
Visualizing Success: Using Graphics in Sports Analysis
Sports analysis is the process of examining and evaluating various aspects of a sport to gain insights that can be used to improve player performance, team strategies, and game outcomes. The analysis of sports has become an integral part of both professional and amateur sports, as it helps teams and players to identify areas of improvement and fine-tune their skills and techniques. This guide will take you through the techniques and strategies involved in sports analysis and how you can use them to improve your game.
1) Collecting Data: The first step in sports analysis is collecting data. The data can be anything from game statistics, player performance metrics, to video recordings of past games. Collecting this data helps to create a starting point for analysis and can provide a baseline to compare current performance to. There are several data collection tools available in the market such as wearable technology like fitness trackers, video cameras, and specialized equipment to help collect data.
2) Analyzing Data: Once the data is collected, the next step is to analyze it. Data analysis involves studying the trends, patterns, and insights from the collected data. There are two primary types of analysis, quantitative analysis, and qualitative analysis. Quantitative analysis involves looking at numerical data like scores, times, and measurements, while qualitative analysis involves reviewing non-numerical data like player gestures and behaviors. There are numerous software tools available such as Tableau, Excel, RStudio, and Python packages for data analysis in sports.
3) Building Models: The next step in sports analysis is to use the insights from data analysis to build models that can help predict future outcomes. Models are used to identify potential weaknesses, strengths, and strategies that can be used to improve performance. A model can be anything from a physical training regimen to a tactical play. There are several modeling techniques available such as machine learning and regression models that are used to create models in sports analysis.
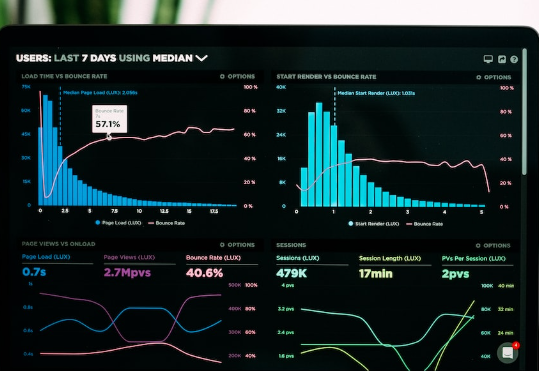
4) Visualization Techniques: The ability to present data in a visually appealing way is crucial to its understanding. Visualization techniques are used to present the insights gained from data analysis in a manner that is easy to understand. Visualization can range from simple charts and graphs to interactive dashboards and heat maps. There are several visualization tools available in the market such as PowerBI, Tableau, and D3.js.
5) Communication: Once the insights and models are generated, the next step is to communicate them effectively. Communication can be in the form of reports, presentations, and dashboards. The communication should be easy to understand and use simple language suitable for the target audience. It should highlight the conclusions and recommendations and provide clear next steps to improve game outcomes.
Conclusion:
eat-and-run verification (먹튀검증) Sports analysis is a critical aspect of game improvement, and it has been proven to be effective in elevating player performance, identifying weaknesses, and creating winning strategies. This guide has provided an overview of the techniques and strategies involved in sports analysis, from collecting data to communicating insights effectively. Whether you are an amateur player or a professional coach, sports analysis is a valuable tool that can help elevate your game.